All docs pages
Session Replay
Replay scrubs the HeatMap back through a session. Pick today or one of the five sessions before it, then drag the scrubber or press play to watch the panels change in 5-minute steps, so you can see how the gamma structure, the map of dealer-hedging levels, set up the moves you watched. Replay is a Pro feature.
- Where it is: the REPLAY bar directly under the HeatMap control bar.
- Which days: Today plus the five weekdays before it, labeled like Wed 11/18.
- How you use it: drag the scrubber, or press ▶ to play from the open. The 1× button cycles the speed.
- Steps: one frame every 5 minutes from 9:30 AM to 4:00 PM ET.
- What you see: the same panels, chips, and King you read live, drawn in the Dealer Positioning view.
- Getting back: drag to the right end (Live) or pick Today.
- Educational only, not financial advice.
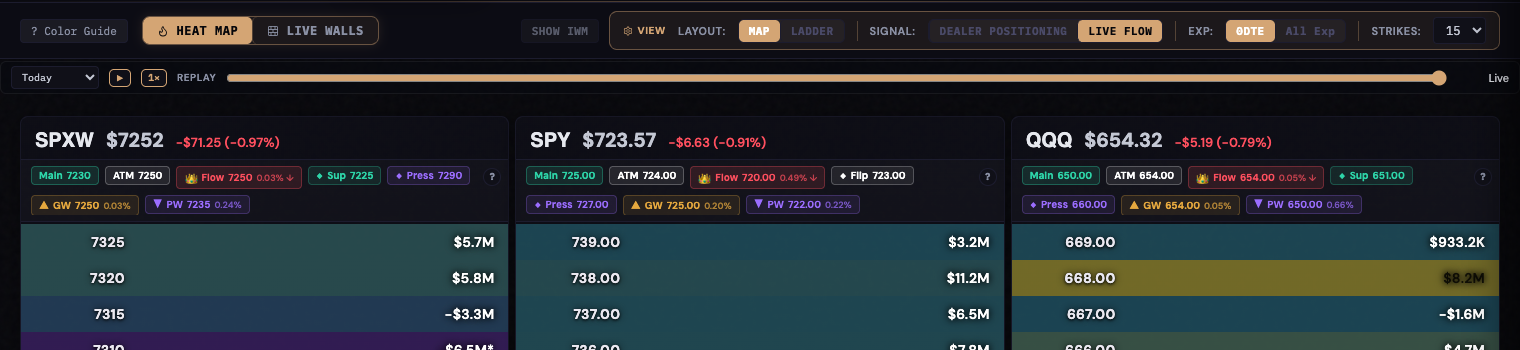
What replay shows
The live HeatMap shows you where the strongest gamma levels sit right now. That view keeps moving, so once a level breaks and price runs, the picture that set up the move is gone.
Replay keeps that picture. StrikeGEX archives the HeatMap through each session, and the replay bar redraws the panels you already read on the live tab as they stood at a past moment: the 👑 Flow King (the strongest gamma magnet near price), the ▲ GW Gamma Wall and ▼ PW Put Wall (strikes that tend to act as resistance and support), the other key-level chips, and the column of strikes around spot. Your Show IWM and Strikes settings still apply.
A few things differ from the live board:
- Every frame uses Dealer Positioning. The archive keeps the open-interest view only, so frames draw as DEALER POSITIONING whatever Signal you have selected. The label on the right end of the bar says so, for example 10:35 ET · Dealer Positioning. Back at Live, the board returns to your own Signal.
- The header skips the day change. Replay panels show the symbol and spot price but not the change against the prior close.
- The strike window is capped. Frames keep about 35 strikes on each side of spot, so at Strikes 40 or 60 a replay panel shows fewer rows than the live one.
- Replay draws on the MAP layout. If Layout is set to LADDER, the ladder keeps showing live data. Switch Layout to MAP to watch a replay.
The replay bar
| Control | What it does | When to use it |
|---|---|---|
| Day select | Today plus the five weekdays before it, oldest first. Picking a past day loads that session and parks at its close. Market holidays still appear in the list and show No session data. | To study yesterday's structure before today's open, or to compare two sessions. |
| ▶ / ⏸ | Plays the session forward and pauses it. Pressed at the right end of the bar, play starts from the open. On today's session, play stops at the latest frame and hands the board back to Live; on a past day it stops at the close. | To watch the King and walls move without dragging. |
| 1× | Cycles the play speed 1× → 2× → 4×. At 1× the board advances one 5-minute frame about twice a second; 2× and 4× skip ahead two and four frames at a time. | 4× to skim a whole day, 1× around the moment you care about. |
| Scrubber | Drag to any point in the session. Dragging pauses playback. The right end is Live on today and the close on a past day. | To jump straight to the time a level broke. |
| Label | Reads Live at the right end of today. Otherwise it shows the frame time in ET and Dealer Positioning, with the day in front on a past session, for example Wed 11/18 15:55 ET · Dealer Positioning. | To confirm which moment you're looking at. |
Walkthrough
- Open the HeatMap tab and make sure Layout is set to MAP.
- In the REPLAY bar, leave the day on Today or pick a recent session.
- Drag the scrubber left. The panels redraw for that frame and the label shows its time.
- Read the frame the same way you read the live tab: find the 👑 King, note the ▲ GW and ▼ PW chips, and compare row brightness. Brighter rows are stronger levels.
- Press ▶ to play forward from there, and watch how the King and walls shift, build, or fade from one frame to the next.
- Drag back to the right end, or choose Today, to return to Live.
Ways to use it
Review a level that broke
Price sliced through a strike you expected to hold. Scrub back to the frames before the break and look at that level. Was it already thinning out, or did it look solid right up to the moment price went through it? Seeing the structure that came before the move is how you calibrate what "strong" actually looked like on that day.
See whether a wall was building or decaying
Step the same strike through consecutive frames. A wall that grows from one frame to the next was strengthening into the move; one that shrinks was decaying. That building-versus-fading read pairs directly with Live Walls, which badge wall strength changing in near-real time during the session.
Prepare with yesterday's map
Before the open, pick yesterday in the day select and play it at 4×. Note where the King sat into the close and which walls held, then switch back to Today.
When replay resets or can't load
- Leaving the board. Switching to another tab or to LIVE WALLS sends replay back to Live and the day back to Today. The replay bar is hidden while Live Walls is on.
- Live updates while you replay. The app keeps checking for new data, but it won't repaint over a past frame. Return to Live to see the latest board.
- No session data means the archive has no frames for that day, such as a market holiday. The play, speed, and scrubber controls go inactive until you pick another day.
- Replay unavailable means the session couldn't load. Pick a different day and then switch back, or reload the page, to try again.
StrikeChart has its own replay
The StrikeChart tab replays its candle chart and GEX levels separately from the HeatMap. On desktop, choose the Replay workspace mode or click Study session; on a phone the scrubber stays on the chart all the time. It has the same controls: a ▶ button, the 1× / 2× / 4× speed cycle, a scrubber with Live at the right end, and, for Pro members, the same day select with Today and the five weekdays before it.
Common questions
- How far back can I go?
- The day select lists today and the five weekdays before it. Older sessions aren't available in replay.
- Why does replay show Dealer Positioning when I have Live Flow selected?
- The archive stores the open-interest view only, so every frame draws as Dealer Positioning. Your Signal setting comes back as soon as you return to Live.
- I dragged the scrubber and nothing changed.
- Check the Layout. Replay draws on MAP; the LADDER layout keeps showing live data. Also check the label: No session data or Replay unavailable means there's nothing to draw for that day.
- Where did the History tab go?
- It was retired, and replay on the HeatMap took its place. It covers the same job with finer steps and more days. Bookmarks to /history open the HeatMap.
- I don't see the replay bar.
- Replay is part of Pro, so the bar only appears on Pro accounts. It's also hidden while LIVE WALLS is on; switch back to HEAT MAP.